How to debug the DeepSeek Harness desktop app: DSH_DESKTOP
The DeepSeek Harness desktop app opens debug ports through three environment variables: DSH_DESKTOP_MAIN_INSPECT_PORT (default 9229, main process), DSH_DESKTOP_RENDERER_DEBUG_PORT (default 9222, renderer) and DSH_DESKTOP_HOST_INSPECT_PORT (default 9230, host process), plus DSH_DESKTOP_OPEN_DEVTOOLS for developer tools. This guide covers the port roles, how to open DevTools and how to run in development mode.
Which debug ports the DeepSeek Harness desktop app has: three DSH_DESKTOP variables
The DeepSeek Harness desktop app has three debug port variables: DSH_DESKTOP_MAIN_INSPECT_PORT (default 9229), DSH_DESKTOP_RENDERER_DEBUG_PORT (default 9222) and DSH_DESKTOP_HOST_INSPECT_PORT (default 9230) (source). One by one:
DSH_DESKTOP_MAIN_INSPECT_PORT(9229) — the main-process debug port. Expected: attach a main-process debugger to diagnose window and lifecycle issues.DSH_DESKTOP_RENDERER_DEBUG_PORT(9222) — the renderer debug port. Expected: the interface layer's console and network requests show up here.DSH_DESKTOP_HOST_INSPECT_PORT(9230) — the host-process debug port. Expected: diagnose the process carrying host logic.- Change ports as needed — when a default port is taken, export the same-named variable before launch. Expected: switching to a free port resolves it.
- Open only what you need — for interface issues alone, start with 9222. Expected: no need to open all three.
How to open DevTools and development mode in the DeepSeek Harness desktop app
Use DSH_DESKTOP_OPEN_DEVTOOLS to control whether developer tools open automatically; start development mode in the repository with pnpm run dev:desktop (source). Follow these steps:
- Set the DevTools switch — set
DSH_DESKTOP_OPEN_DEVTOOLSbefore launching. Expected: useful when the interface debug panel should open automatically. - Launch a debug instance — start the desktop app with the port variables above. Expected: the debug ports begin listening.
- Attach a debugger — connect to the main process on 9229 and inspect the interface on the renderer port 9222. Expected: you can see the console and network in DevTools.
- Run in development mode — run
pnpm run dev:desktopfrom source. Expected: code changes reflect immediately, which suits diagnosing the desktop shell and plugin loading. - Reset the variables — clear the temporary variables when done. Expected: everyday use should not leave debug ports open.
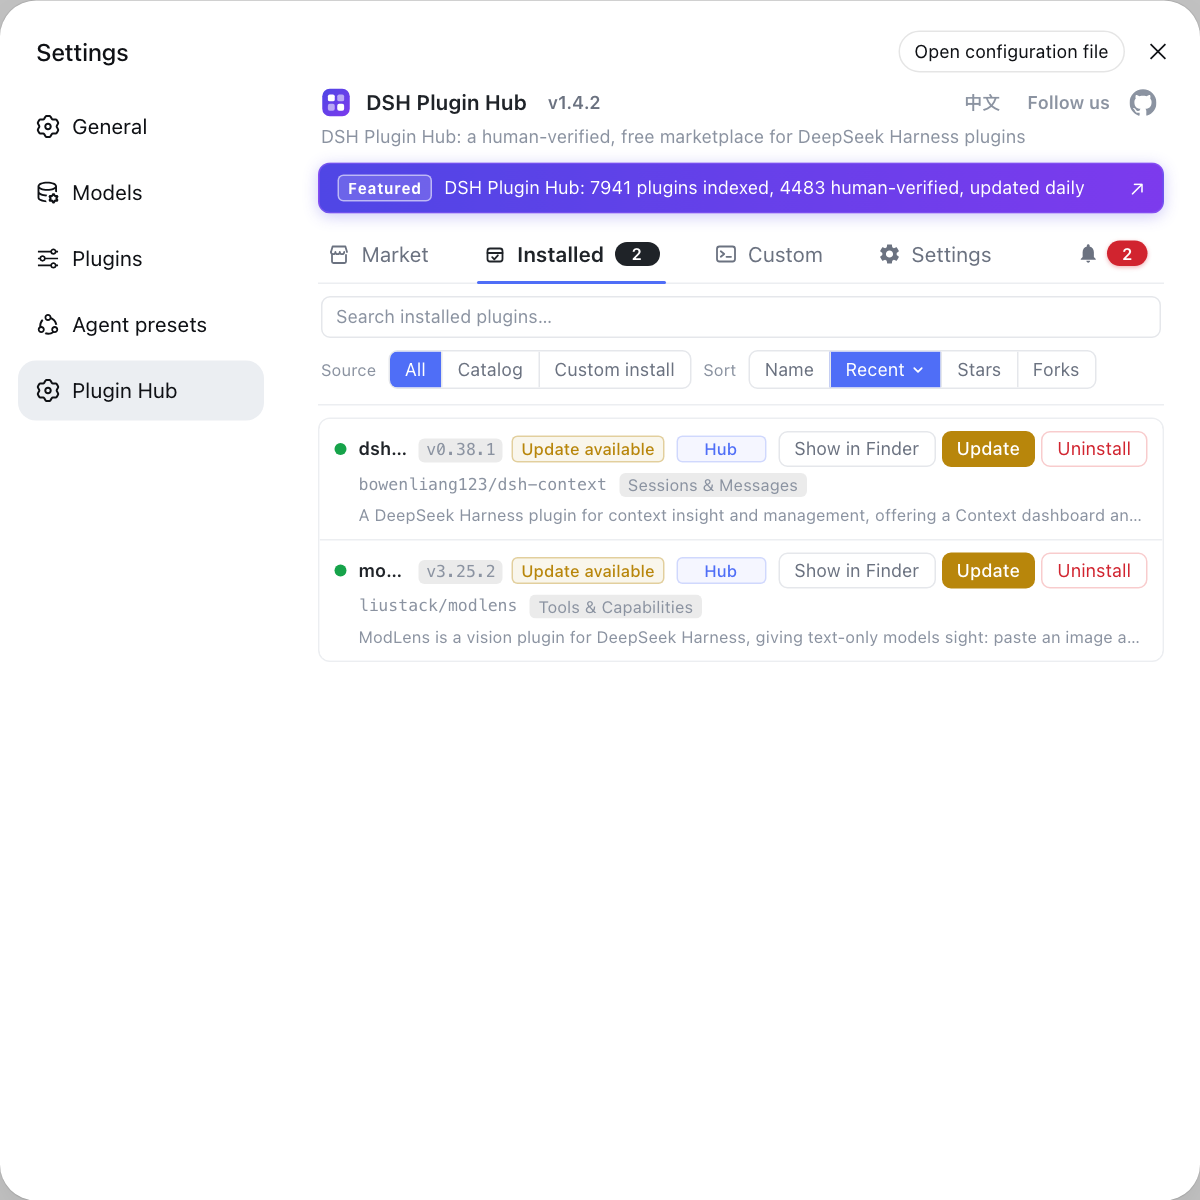
When debugging how DSH plugins load in the desktop app, first confirm with the DSH Plugin Hub that the plugin is installed in the desktop profile.
How the DeepSeek Harness desktop debug ports relate to web UI 3080
The desktop debug ports (9222, 9229, 9230) are Electron debug channels, a different thing from the dsh web UI service port 3080, with different ranges that do not conflict when both run (source). Three points:
- Different purposes — debug ports connect developer tools, while 3080 serves the web UI to a browser. Expected: one for diagnosis, one for use.
- Different ranges — debug ports sit in 92xx and the web UI on 3080. Expected: they never take each other's port.
- Both can run — the two coexist. Expected: debugging the desktop app while the web UI is open is fine.
- Web UI is configured separately — for the access address and settings see How to use the dsh web UI.
Caveats and limits of DeepSeek Harness desktop debugging
- Do not leave debug ports open: they are a developer channel and should be closed for everyday use to avoid exposing local interfaces.
- Change ports on conflict: when 9222/9229/9230 are taken, export the variables to free ports before launch.
- Development mode targets source:
pnpm run dev:desktopneeds the repository and dependencies, while ordinary users just install the release. - Confirm plugins are installed first: for a plugin problem, confirm it is installed in the desktop
profiles/desktop, see Is desktop config separate. - Do not delete the lock file: single-instance is guaranteed by
profiles/desktop/lock, so after repeated debug launches and odd behavior, first confirm no stale process remains.
Sources: Desktop README (official repository)
FAQ
The DeepSeek Harness desktop app has three debug port variables: DSH_DESKTOP_MAIN_INSPECT_PORT defaults to 9229 for the main process, DSH_DESKTOP_RENDERER_DEBUG_PORT defaults to 9222 for the renderer, and DSH_DESKTOP_HOST_INSPECT_PORT defaults to 9230 for the host process.
The environment variable DSH_DESKTOP_OPEN_DEVTOOLS controls whether developer tools open automatically, so set it before launching the desktop app. To inspect manually, connect through the renderer debug port instead.
No, they are two different things: the desktop debug ports default to 9222, 9229 and 9230 as Electron debug channels, while 3080 is the dsh web UI service port. Their ranges differ, so running both at once does not conflict.
Run pnpm run dev:desktop in the repository to start development mode, and combine it with the debug port variables to set breakpoints and inspect the interface. That command targets source development; ordinary use just needs the released build.
Related Terms
- DSH_DESKTOP_MAIN_INSPECT_PORT
- DSH_DESKTOP_MAIN_INSPECT_PORT is the debug port variable for the DeepSeek Harness desktop main process, defaulting to 9229, used to attach a main-process debugger.— DeepSeek Harness desktop README
- DSH_DESKTOP_RENDERER_DEBUG_PORT
- DSH_DESKTOP_RENDERER_DEBUG_PORT is the debug port variable for the DeepSeek Harness desktop renderer, defaulting to 9222, used for DevTools on the interface layer.— DeepSeek Harness desktop README
- DSH_DESKTOP_HOST_INSPECT_PORT
- DSH_DESKTOP_HOST_INSPECT_PORT is the debug port variable for the DeepSeek Harness desktop host process, defaulting to 9230, used to debug the process carrying host logic.— DeepSeek Harness desktop README
- DevTools
- DevTools is the developer tooling built into Electron, opened in the DeepSeek Harness desktop app through DSH_DESKTOP_OPEN_DEVTOOLS and the renderer debug port to view the console and network requests.— DeepSeek Harness desktop README
Sources
- DeepSeek Harness desktop README· deepseek-ai